“How did you go bankrupt?” Bill asked. “Two ways,” Mike said. “Gradually and then suddenly.” Ernest Hemingway, The Sun Also Rises, 1926. The financial position of the federal government of the United States has been gradually deteriorating for decades. It is now rushing headlong to the financial tipping point that will cause it to default onRead more

Blog

Money is routinely defined by what it does, rather than what it is. That is unfortunate because its modern definition overlooks money’s important – but now forgotten – fourth function. Aristotle observed that money is a medium of exchange, unit of account, and store of value. This definition omits the fourth function needed to explainRead more

In 1922 Benito Mussolini became prime minister of Italy, putting that country on a path that had global ramifications. He was the world’s first fascist leader. Other fascists soon followed with fanciful promises that were varied but tuned in to what people wanted to hear. Their problems would be solved, whether the restoration of order,Read more

Some interesting data on housing prices in the United Kingdom(1) was recently published by Savills, one of the world’s leading property agents. The important messages that can be drawn from this data apply globally, namely, that fiat currency has a clear and direct impact on prices that can lead to a variety of misconceptions aboutRead more

“The Earth speaks to us through the elements of nature. In every natural thing, we can find a hidden, powerful message.” Ralph Waldo Emerson Every natural element to which the earth has been endowed has a usefulness – a purpose. If we listen to gold, one of the earth’s natural elements, its message is loudRead more
By James Turk | Market Commentaries | Comments are Closed | 13 April, 2022
The German version of The Epoch Times newspaper published an interview by Roman Baudzus with James Turk on April 8, 2022, which was also posted online and can be read at this link. With their permission to publish the English version, the interview follows: RB: I would like to start our conversation with a lookRead more

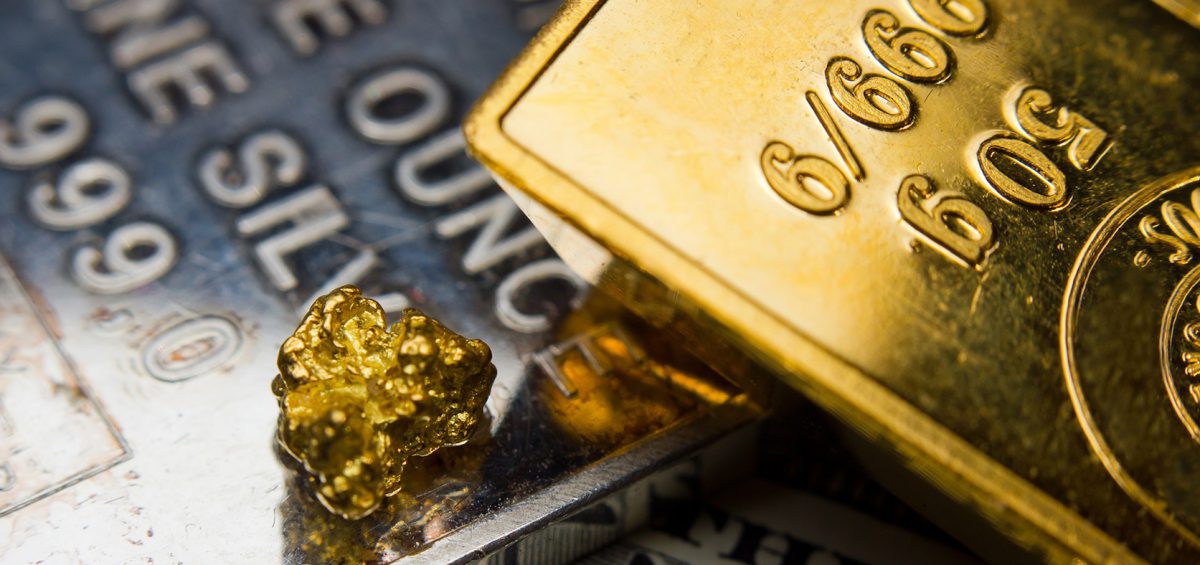
Silver continues to underperform gold, but I believe that is about to change. It may happen as soon as this week after the Federal Reserve announces its half-hearted effort to control inflation by raising interest rates only .25% or .50%. Based on last Friday’s closing prices, it took 76 ounces of silver to equal theRead more

By James Turk | Market Commentaries | Comments are Closed | 9 February, 2022
It was not long after the internet began appealing to a wide audience with the adoption of browsers in the late 1990s that virtual currency appeared in online gaming. The potential of virtual currency opened a world of new possibilities, and entrepreneurs acted. Capitalism creates new products to replace those when they fail to provideRead more
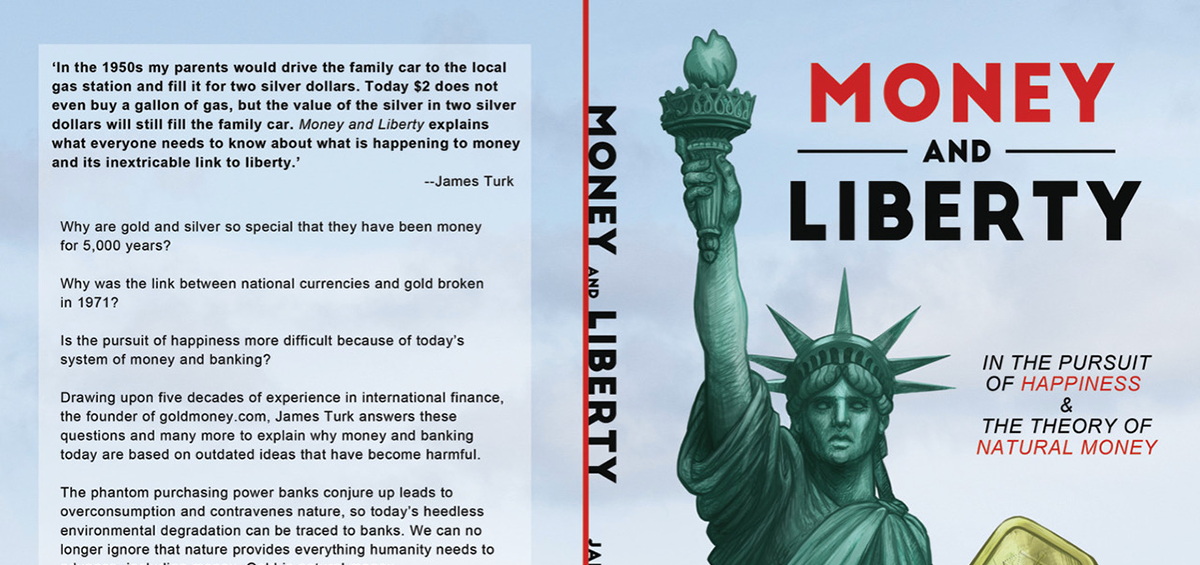
Several people have asked why I wrote Money and Liberty: In the Pursuit of Happiness & The Theory of Natural Money while others requested some insight about its content. My objective was to explain why: gold is money and not an ‘investment’, which is not well understood these days, even among many in the goldRead more

By James Turk | Market Commentaries | 0 comment | 17 April, 2019
In an article last year entitled “Bankruptcy 1995 Revisited”, I presented a detailed analysis of the US government’s financial position. It wasn’t a pretty picture then, and it looks even worse now. When you take away the political posturing, promises and rhetoric surrounding the US government’s financial position, all the cold, hard facts boil downRead more
JAMES TURK
GOLDMONEY

MONEY AND LIBERTY
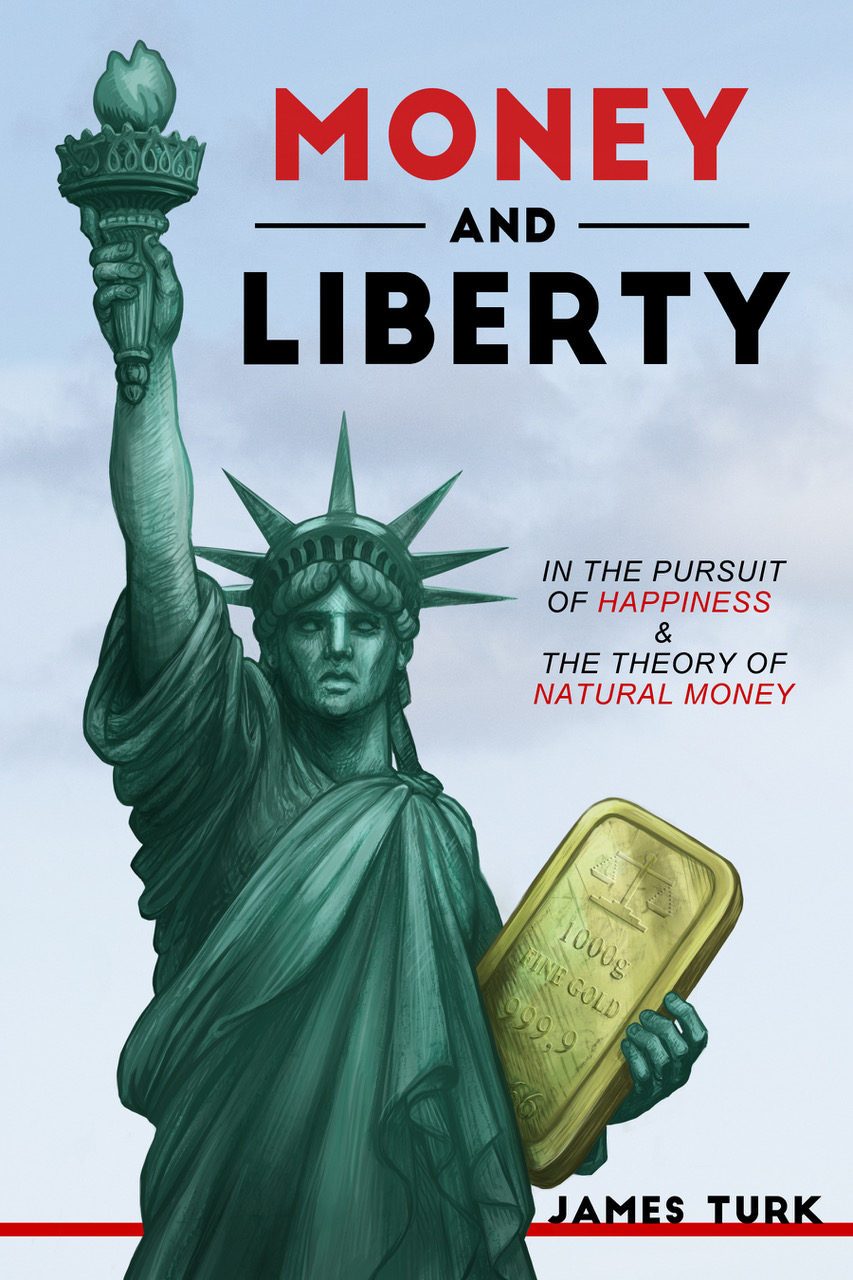
“James Turk’s background is in banking and asset markets, not academic economics where careers are made on the promotion of institutional dogma often divorced from reality. This practical stance informs his book throughout, with much material that gets to the heart of the matter, and has stood the test of experience. Money and Liberty delivers plenty of core knowledge, from a practitioner involved in these topics for decades.” Forbes
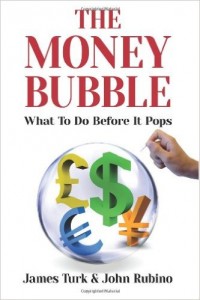
MONEY BUBBLE
COLLAPSE OF THE DOLLAR
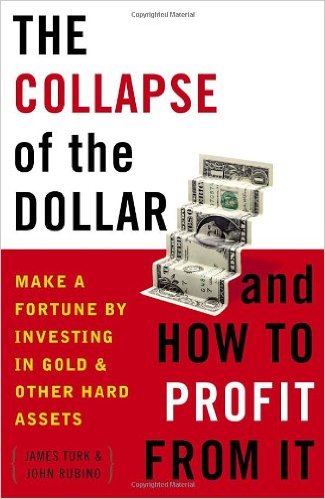
COMING COLLAPSE OF THE DOLLAR
ABOUT
 My objective is to share with you my views on gold, which in recent decades has become one of the world’s most misunderstood asset classes. This low level of knowledge about gold creates a wonderful opportunity and competitive edge to everyone who truly understands gold and money.