August 10, 2009 – Given all the euphoria after the unemployment number was released on Friday, one would think that the economic contraction had ended. Unfortunately, the euphoria was misguided.
The reality is that unemployment continues to worsen. Non-farm payrolls in July continued the dreadful, protracted decline that began from the peak of employment in November 2007. The only thing that has changed is that the rate of decline has lessened. In other words, the rate at which jobs are being lost is declining, which obviously had to happen sooner or later.
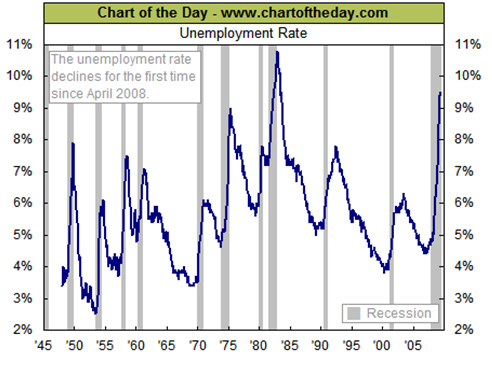
The accompanying chart presenting the unemployment rate overlaid on top of recessions is not a pretty picture. Note the width of the gray line of the current economic situation compared to past recessions. We are in the longest economic contraction in the post-war period, which basically means we are in the worst contraction since the Great Depression.
The second chart isn’t much better. It presents the decline in GDP in two ways. The blue line shows the headline rate of contraction. The red line shows the contraction in GDP, excluding the government. There are different ways to interpret the message from this chart.
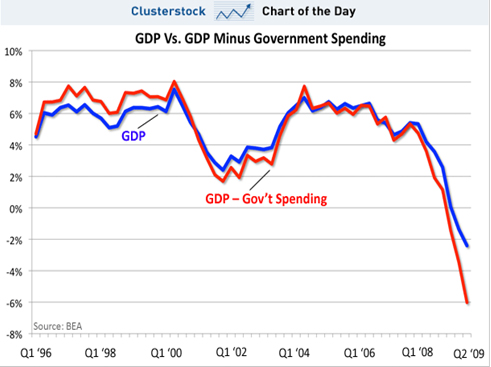
Clearly, GDP would be contracting at an even greater rate if it weren’t for the government spending so much money. In other words, government spending is keeping the contraction from looking even worse, but that is not necessarily good news. The private sector – which is after all the sector of the economy that creates real wealth through the myriad of goods and services it produces – is contracting at an even greater rate than the numbers appear.
We need to recognize that government spending does not really improve the economic situation. We have to keep in mind that the government is simply taking money from the private sector through taxes and then spending that money how it wants, rather than letting the private sector make that choice. Given the short-term focus and the obvious political orientation of government decisions, it is safe to assume that it is spending the money in ways far more different than the private sector would be spending it, and not necessarily the best ways.
We all know about government largesse, but the point is that the private sector would be investing much of that money for the benefit of future growth and productivity. In contrast, although the government may call it ‘investing in the future’, it is simply spending money on politically motivated objectives, focused on consumption rather than investment.
Here’s another statistic about the government that I found worrying when I looked at the employment picture in greater detail. This data in the following table is from the federal government’s Bureau of Labor Statistics (BLS).
| Total Employment | Private Sector | Government | |
|---|---|---|---|
| (in millions – seasonally adjusted) | |||
| Nov-07 | 138.0 | 115.7 | 22.3 |
| Jul-09 | 131.5 | 108.9 | 22.6 |
As previously noted, employment peaked in November 2007. The BLS states that 138.0 million people were working that month. There were 115.7 million employed in the private sector, and the balance of 22.3 million were working for government (federal, state and local). But look at what has happened since the economy began contracting. Employment in the private sector has contracted by 6.8 million jobs, or -5.9%, while government employment has actually increased.
It is no wonder there seems to be a groundswell of discontent growing throughout the States. Fewer working people are carrying an ever greater burden of people in government. And those people who have lost their jobs are resentful that government workers are immune to the pains of a severe economic contraction.
In any case, to return to the main point, employment continues to decline. Consequently, the economy is still contracting, and will continue to do so until employment once again begins to increase. Unfortunately, we can’t predict when that will happen, but it does not appear that employment is ready to rebound anytime soon.
Years – decades really – of imprudent bank lending created a boom that was unsustainable. A bust inevitably follows the boom as banks and borrowers attempt to bring their overleveraged balance sheets back to positions of solvency and strength.
Politicians can put the gloss on this economic contraction and call it whatever they want. But given the depth and breadth of the decline, it seems clear to me that we are in a depression.
 My objective is to share with you my views on gold, which in recent decades has become one of the world’s most misunderstood asset classes. This low level of knowledge about gold creates a wonderful opportunity and competitive edge to everyone who truly understands gold and money.