In 1933 the US government defaulted on its debt by not repaying the gold it owed. In 1965 it allowed its central bank to default on the silver it owed. These two precious metals are the money of the American Constitution. They defined the dollar as an amount of precious metal weight.
Linking the currency to a precious metal is wise and prudent monetary policy. Adherence to it limits the quantity of dollars that can be issued relative to the weight of metal in the US Treasury’s vaults, thereby preventing debasement of the dollar’s purchasing power, generally called ‘inflation’. Unfortunately, common sense and cautious banking practices were abandoned with predictable results. The two defaults followed when new debts generated by banks caused the quantity of dollars to rise until they became too large relative to the weight of metal backing them, at which point confidence in the currency broke. What was $35 per ounce of gold in 1971 is now approximately $4,800.
Today’s fiat dollar is not tied to precious metals, severing the link to a primary constitutional principle that imposed indispensable discipline on US government spending and the banking system. In the absence of that discipline, the US government is living beyond its means, which means everyone else is living below theirs.
The government’s spending aspirations are being funded with debt, giving rise to newly created dollars being conjured up by the Federal Reserve and the nation’s banks. This ever higher quantity of dollars is being debased with a 2%p.a. inflation target, but the loss of purchasing power each year is generally higher in practice, and often much higher.
This erosion of the fiat dollar’s purchasing power cannot be viewed in isolation. Like the gold dollar and silver dollar before it, today’s fiat dollar is very much tied into the US government’s financial position, which has been gradually deteriorating for decades by an increasing debt burden caused by overspending. The similarity to its two previous defaults is ominous.
The US government is rushing headlong toward the financial tipping point that will cause it to default on its promises yet again. Its debt load is becoming too big and beyond the US government’s financial capacity to return to its creditors the purchasing power they loaned to the government. That is even before considering the interest due to creditors to compensate them for the risk they take by lending their purchasing power to a spendthrift government that has jettisoned its constitutional requirements.
In an October 2023 article, I identified a tipping point for the next US government default, when its Insolvency Ratio of its interest expense and revenue hit 30%. I projected it would arrive in 2025. It did not arrive on that schedule but has not been avoided. It is just delayed because interest rates rose more slowly than I projected.
This article updates those projections. But first, it is necessary to explain how US government announcements misstate in two ways its true financial position. It uses cherry-picked data that flatter the government’s position that is unfortunately reported by the mainstream media in their financial commentary. Both are explained here for readers who have elsewhere seen other figures and wondered why my numbers differ. The true results require some digging into the US government’s financial position as reported in its Monthly Treasury Statement (MTS), which is the source used throughout this article.
One: Gross Interest, Not Net
I use gross interest on Treasury debt securities as the numerator for the Insolvency Ratio. It is the total interest the Treasury pays on all its debt. For fiscal year (FY)2025 that figure is $1,215,614 million, Table 3 of the MTS.
Much financial commentary, however, uses “net interest” from Table 9 of the MTS, which is $970,359 million for FY2025. The difference of $245 billion represents interest the Treasury pays on debt instruments held by its own trust funds – Social Security, Medicare, military retirement, civil service pensions, and others. These are real obligations, and the interest paid on them represents the government’s liability to the funds’ beneficiaries. Netting it out understates the government’s true interest burden by $245 billion and produces an artificially lower Insolvency Ratio.
Two: The True US Government Deficit
The government reports a “budget deficit” of $1,775,357 million for FY2025. This figure is almost universally cited, but Table 6 of the MTS tells a different story. Total Treasury Securities Outstanding rose from $35,464,674 million at the start of FY2025 to $37,637,553 million at the close, an increase of $2,172,879 million. That $397 billion gap between the reported deficit and the actual increase in debt arises from off-budget items and various unconventional accounting treatments that exclude real borrowing from the headline budget deficit number. The increase in total debt outstanding is what actually happened to the national balance sheet. It is the only honest measure of how much deeper in the hole the government went in FY2025. I use the annual increase in debt – the true deficit – throughout this update.
With those two explanations established, here are the key FY2025 figures from the MTS:
TABLE 1. Federal Government Financial Results for FY 2025
| Measure | Reported / Media Figure | Correct MTS Figure | Source |
| Interest expense | $970B (net interest) | $1,215.6B (gross) | MTS Table 3 — highlighted line |
| Budget deficit | $1,775B (unified budget) | $2,172.9B (debt increase) | MTS Table 6 — securities outstanding |
| Insolvency Ratio | ~18.6% (net basis) | 23.2% (gross basis) | Gross Interest ÷ Total Revenue |
The Math Pointing to Default
Defaults rest on numbers — specifically the cash flow of revenue and outlays and their relation to total debt outstanding. The key equation in my analysis is the Insolvency Ratio.
A 30% ratio is generally seen as the tipping point that historically ignites a monetary, economic, and banking crisis. Beyond 30%, the economy is no longer generating enough wealth to service the debt load, creating a vicious spiral because the interest clock runs continuously. When overindebted, the interest expense burden begins to exceed all other spending. Interest rates then rise because of the growing risks of debasement and default, causing deficits to accelerate, which in turn cause the debt mountain to grow faster. At 30% the government faces a stark choice between overt default or currency debasement often resulting in hyperinflation.
The following table presents the federal government’s financial results from 1980 through the FY2025. The Implied Interest Rate is Gross Interest divided by the year’s Average Debt. The column “Outlays Less Gross Interest” shows what the government spends on everything other than debt service.
TABLE 2. Federal Government Financial Results, 1980–2025 (selected years)
| Fiscal Year | Federal Debt ($M) | Average Debt ($M) | Gross Interest ($M) | Implied Interest Rate | Federal Revenue ($M) | Outlays ($M) | Outlays Less GI ($M) | Insolvency Ratio |
| 1980 | 909,041 | 869,254 | 74,803 | 8.61% | 517,112 | 590,941 | 516,138 | 14.5% |
| 1985 | 1,817,423 | 1,691,004 | 178,871 | 10.58% | 734,037 | 946,344 | 767,473 | 24.4% |
| 1986 | 2,120,501 | 1,968,962 | 190,272 | 9.66% | 769,155 | 990,382 | 800,110 | 24.7% |
| 1990 | 3,206,290 | 3,037,045 | 264,691 | 8.72% | 1,031,958 | 1,252,993 | 988,302 | 25.6% |
| 1991 | 3,598,178 | 3,402,234 | 285,421 | 8.39% | 1,054,988 | 1,324,226 | 1,038,805 | 27.1% |
| 1992 | 4,001,787 | 3,799,983 | 292,294 | 7.69% | 1,091,208 | 1,381,529 | 1,089,235 | 26.8% |
| 1993 | 4,351,044 | 4,176,416 | 292,479 | 7.00% | 1,154,334 | 1,409,386 | 1,116,907 | 25.3% |
| 1994 | 4,643,307 | 4,497,176 | 296,253 | 6.59% | 1,258,566 | 1,461,752 | 1,165,499 | 23.5% |
| 2000 | 5,628,700 | 5,617,112 | 352,345 | 6.27% | 1,827,452 | 1,788,950 | 1,436,605 | 19.3% |
| 2008 | 9,986,082 | 9,468,413 | 402,429 | 4.25% | 2,303,466 | 2,982,544 | 2,580,115 | 17.5% |
| 2019 | 22,669,466 | 22,065,872 | 522,644 | 2.37% | 3,421,164 | 4,446,960 | 3,924,316 | 15.3% |
| 2021 | 28,385,562 | 27,644,009 | 572,884 | 2.07% | 4,047,111 | 6,553,621 | 5,980,737 | 14.2% |
| 2022 | 30,838,586 | 29,612,074 | 717,568 | 2.42% | 4,897,399 | 6,273,324 | 5,555,756 | 14.7% |
| 2023 | 33,167,334 | 32,002,960 | 879,307 | 2.75% | 4,439,284 | 6,134,432 | 5,255,125 | 19.8% |
| 2024 | 35,464,674 | 34,316,004 | 1,133,037 | 3.30% | 4,918,106 | 6,734,896 | 5,601,859 | 23.0% |
| 2025 | 37,637,553 | 36,551,114 | 1,215,614 | 3.33% | 5,234,616 | 7,009,974 | 5,794,360 | 23.2% |
In 1980 when Federal Reserve Chairman Paul Volcker was raising interest rates to fight inflation, the implied interest rate on the average debt was 8.61%, and the Insolvency Ratio was 14.5%. The situation was manageable despite the high nominal rates because the total debt was still relatively small. As interest rates declined through the 1980s and into the 1990s, the Insolvency Ratio paradoxically rose because irresponsible federal spending resulted in continual budget deficits and a growing debt mountain that offset the benefit of falling rates.
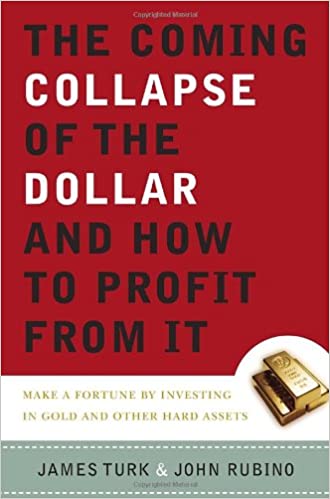
The ratio hit 27.1% in 1991, the year the alarm bells rang loudest because a best-selling book titled “Bankruptcy 1995: The Coming Collapse of America and How to Stop It” reached a mass audience. The 30% Insolvency Ratio that generally triggers a crisis was within sight. Instead of reversing course to stop uncontrolled spending to end perpetual deficits, politicians chose a shameful alternative. The government began pushing the Insolvency Ratio lower because the Federal Reserve manipulated interest rates below unfettered free market levels, artificially lessening the cost of debt.
The financial repression ‘worked’; it bought time. By keeping interest rates artificially low, the implied interest rate on the debt fell decade by decade even as the amount of debt soared. The Insolvency Ratio declined from 27.1% in 1991 to 14.2% in 2021, even as total debt rose from $3.6 trillion to $28.4 trillion.
It is essential to understand the math behind lower interest rates and just as importantly, that the Insolvency Ratio was suppressed by policy, not by fiscal discipline. Deficits and the debt mountain grew throughout, but interest suppressed to artificial levels enabled politicians to kick the can a few more years without solving the underlying problem that the federal government was living beyond its means.
The post-pandemic surge in inflation forced the Federal Reserve to begin raising interest rates in 2022. The consequence of decades of financial repression was immediate and dramatic. The Insolvency Ratio jumped from 14.7% in 2022 to 19.8% in 2023, a 5-point surge in a single year. It continued rising to 23.0% in FY2024 and 23.2% in FY2025. We are now in the same territory we occupied in the late 1980s on the way up to the 1991 alarming level, but with a debt load more than ten times bigger and without the headroom Paul Volcker had available to raise interest rates without triggering insolvency alarm bells.
Rushing Toward the Tipping Point
The mechanism I described in 2023 is operating exactly as I expected. As the debt rises, so does the interest expense from carrying it. Without cuts to other spending — which are not happening — the growing interest expense deepens the deficit and requires more borrowing. More borrowing increases the amount of debt. A larger debt at higher interest rates generates yet more interest expense, creating the spiral toward insolvency.
The 30% tipping point was not reached in 2025. It didn’t happen because I projected the implied interest rate on the debt would be 3.74% in FY2024 and 4.37% in FY2025. The actual figures were 3.30% and 3.33% respectively. The Federal Reserve’s rate-cutting cycle that began in late 2024, combined with the weight of debt rolling to shorter-duration at lower yields, kept the implied rate lower than I anticipated. My direction was correct, but not the timing. Being approximately two years early changes nothing about the destination.
Roughly $9 trillion in pre-2022 low-rate debt remains outstanding. As it matures and is refinanced at current market rates of 4% or higher, the inevitability of math will contribute to a worsening debt spiral that will erode the dollar’s purchasing power, causing demand for it to fall as its holders seek safer alternatives. The Federal Reserve’s balance sheet operations are currently absorbing approximately $540 billion per year in Treasury demand — artificially suppressing rates — but this cannot continue indefinitely without adverse consequences for the dollar’s exchange rate and for inflation.
Following are two updated scenarios, both anchored to FY2026 half-year actuals. The only variable between them is the speed of implied interest rate repricing, and the revenue growth assumption that flows from the macro environment each scenario implies.
Scenario A — Gradual Rate Normalization
In this scenario the Federal Reserve’s “ample reserves” regime persists with only modest resistance from incoming Fed Chair Kevin Warsh. T-bill purchases of about $40 billion per month continue absorbing a significant share of new issuance. The implied rate on total federal debt rises steadily as approximately one-third of publicly-held debt matures and rolls at current 4%+ market rates, but no disorderly repricing occurs. Revenue grows at a realistic level but below the pace of Treasury estimates, reflecting its track record of official overestimation documented in the MTS.
TABLE 3. Scenario A: Gradual Rate Normalization
| Fiscal Year | Federal Debt ($M) | Average Debt ($M) | Implied Rate | Gross Interest ($M) | Federal Revenue ($M) | Total Outlays ($M) | Outlays Less GI ($M) | Insolvency Ratio | True Deficit ($M) |
| FY2025 | 37,637,553 | 36,551,114 | 3.3258% | 1,215,614 | 5,234,616 | 7,009,974 | 5,794,360 | 23.22% | 2,172,879 |
| FY2026 | 39,937,553 | 38,787,553 | 3.4500% | 1,338,171 | 5,550,000 | 7,600,000 | 6,261,829 | 24.11% | 2,300,000 |
| FY2027 | 42,758,553 | 41,348,053 | 3.7500% | 1,550,552 | 5,883,000 | 8,284,000 | 6,733,448 | 26.36% | 2,821,000 |
| FY2028 | 45,970,128 | 44,364,340 | 4.0000% | 1,774,574 | 6,206,565 | 8,988,140 | 7,213,566 | 28.59% | 3,211,575 |
Result: The 30% tipping point is not reached within the FY2026–2028 window. The Insolvency Ratio reaches 28.6% by FY2028, with total debt at $46.0 trillion and a true annual deficit of $3.2 trillion. The pending crisis is deferred, not avoided.
Scenario B — Stagflation Shock
This scenario is purposefully constructed so the 30% tipping point is reached in FY 2027 to highlight the keen sensitivity to higher interest rates. The assumptions are reasonable, indicating this outcome is not a far-fetched outlier: 1) an oil-price shock driven by the Iran conflict and broader Middle East instability accelerates US consumer inflation; 2) the Federal Reserve, already constrained by the residual inflation from post-pandemic monetary excess, cannot cut rates into an oil-driven price surge without triggering a flight from the dollar; 3) worsening affordability crimps household and corporate spending, depressing the tax base; 4) energy and food cost inflation becomes embedded in Social Security COLAs, Medicaid reimbursements, SNAP, and other entitlement formulas ratcheting up —along with unexpected Iran war costs — federal outlays faster than under the gradual scenario. The implied interest rate rises to 4.09%, which is not an extreme assumption. This rate is only about 75 basis points above the current portfolio average, starkly making clear the sensitivity to higher rates that are low compared to historical experience. A ten-year Treasury yield above 5% is easily reachable, particularly if foreign holders demand a premium for absorbing ever-larger deficits.
TABLE 4. Scenario B: Stagflation Shock (30% Tipping Point in FY2027)
| Fiscal Year | Federal Debt ($M) | Average Debt ($M) | Implied Rate | Gross Interest ($M) | Federal Revenue ($M) | Total Outlays ($M) | Outlays Less GI ($M) | Insolvency Ratio | True Deficit ($M) |
| FY2025 | 37,637,553 | 36,551,114 | 3.3258% | 1,215,614 | 5,234,616 | 7,009,974 | 5,794,360 | 23.22% | 2,172,879 |
| FY2026 | 40,097,128 | 38,867,340 | 3.5500% | 1,379,791 | 5,496,347 | 7,675,922 | 6,296,131 | 25.10% | 2,459,575 |
| FY2027 | 43,447,062 | 41,772,095 | 4.0855% | 1,706,616 | 5,688,719 | 8,558,653 | 6,852,037 | 30.00% ★ | 3,349,934 |
| FY2028 | 47,673,372 | 45,560,217 | 4.4855% | 2,043,622 | 5,859,381 | 9,585,691 | 7,542,069 | 34.88% ★ | 4,226,310 |
Result: The 30% tipping point is reached in FY2027, with total debt at $43.4 trillion and a true annual deficit of $3.35 trillion. By FY2028 the ratio reaches 34.9% — a level historically associated with acute sovereign distress and currency crises. The path to insolvency is a self-reinforcing vicious spiral: higher oil prices mean higher inflation, which means the Fed cannot suppress rates, which means more interest expense, which means a larger deficit, which means more debt issuance, which means still higher yields. At 34.9% more than one dollar in three dollars of federal revenue would be consumed by debt service before a single dollar reaches defence, healthcare or Social Security.
Summary of Tipping Point Scenarios
TABLE 5. Scenario Comparison Summary
| Scenario | Rate Assumption | FY2026 | FY2027 | FY2028 | 30% Tipping Point | Debt at Tipping Point | True Deficit at Tipping Point |
| A — Gradual Normalization | 3.45% → 3.75% → 4.00% | 24.1% | 26.4% | 28.6% | Not reached by FY2028 | N/A within projected window | N/A within projected window |
| B — Stagflation Shock | 3.55% → 4.09% → 4.49% | 25.1% | 30.0% ★ | 34.9% ★ | FY2027 | $43.4 trillion | $3.35 trillion |
The key observation of my original 2023 article remains: the direction is clear and the arithmetic is inexorable. The only genuine variable is timing. Scenario A defers the 30% crisis threshold into the early 2030s. Only marginally higher interest rates in Scenario B bring the tipping point forward to FY2027.
Neither scenario represents an escape from the fundamental problem that the US government is spending far beyond its revenue, funding the gap with debt whose service cost is now large enough to consume about a quarter of all revenue, and growing at an alarming pace. The Federal Reserve’s balance sheet operations can delay the reckoning but only by trading one problem (high interest rates) for another (dollar debasement and inflation). There are no remaining can-kicking alternatives.
America’s politicians, and the voters who put them there, need to make some tough decisions. Without a genuine reversal of uncontrolled spending, the country will continue plunging toward default, with the unpredictable social and political consequences that arise from the collapse of a currency’s purchasing power. Sensible leadership would move the country back to the money of America’s Constitution — gold and silver coin circulating physically hand-to-hand or digitally wallet-to-wallet as the payer and payee may agree.
The practical conclusion for individuals is unchanged from my 2023 article, but the urgency is greater because the debt burden is so much larger: own physical gold and physical silver, not their paper representations. In a crisis, any paper promises will be defaulted upon, just as the U.S. Treasury defaulted on its paper gold certificates in 1933 and on its silver certificates in 1965. The time to prepare is now.
“There is no means of avoiding the final collapse of a boom brought about by credit expansion. The alternative is only whether the crisis should come sooner as the result of voluntary abandonment of further credit expansion, or later as a final and total catastrophe of the currency system involved.” Ludwig von Mises
Data Sources
All financial data from: U.S. Treasury Bureau of the Fiscal Service, Final Monthly Treasury Statement FY2025 (September 30, 2025), Tables 3, 6 and 9; U.S. Treasury Monthly Treasury Statement March 2026 (Table 2); White House OMB Historical Tables (https://www.whitehouse.gov/omb/budget/historical-tables/). Scenario A projection assumptions: FY2026 H1 revenue and outlays locked to MTS actuals; FY2026 H2 revenue at +3.1% on FY2025 H2, outlays at Treasury estimate plus 1% buffer; FY2027 revenue +6.0%, outlays +9.0%; FY2028 revenue +5.5%, outlays +8.5%. Scenario B: FY2026 revenue +5.0%, outlays +9.5%; FY2027 revenue +3.5%, outlays +11.5%; FY2028 revenue +3.0%, outlays +12.0%. Implied rates are hardcoded inputs, not derived from a CAGR formula; Scenario B FY2027 rate (4.0855%) is solved exactly to produce a 30.00% Insolvency Ratio. All Insolvency Ratios use Gross Interest on Treasury Debt Securities (MTS Table 3) divided by Total Budget Receipts. True Deficit = annual increase in Total Treasury Securities Outstanding (MTS Table 6).


 My objective is to share with you my views on gold, which in recent decades has become one of the world’s most misunderstood asset classes. This low level of knowledge about gold creates a wonderful opportunity and competitive edge to everyone who truly understands gold and money.